
The near-collapse of the AI investment bubble in 2026 — and why it may deflate rather than burst in 2027
An extended analysis with data from the Financial Times, The Economist, Gartner, Morgan Stanley, and company filings — plus two theses: that model shrinkage is eroding the case for the buildout, and that dedicated inference silicon arrives on a documented 2027 timetable.
1. Introduction: the year the bubble almost popped
By late 2026, the AI investment story has a new chapter that no one in 2024 would have written: it came close to a near-collapse, wobbled violently, and then — for now — recovered.
The timeline of the "wobble" reads like a stress test of the entire buildout thesis:
- November 2025 — Reuters runs "Bubble Trouble: AI rally shows cracks as investors question risks." Alphabet CEO Sundar Pichai, unusually, concedes that "no company would be unscathed" if the AI boom collapses (Reuters, 21 Nov 2025).
- February–May 2026 — The Financial Times, which compiled the hyperscalers' capex guidance, calls the spending spree "breathtaking" (€569bn, later revised up to ~€625bn), and then publishes "The impossible maths of the AI boom" (19 May 2026), arguing the projected returns struggle to reconcile with the capex.
- May 2026 — The Economist publishes "Big tech is sacrificing its cash flows to prop up the AI boom" (13 May 2026), noting the five biggest spenders will pour ~€690bn into "warehouses with computers to run AI models," with returns "barely" materialising yet.
- June 2026 — Broadcom disappoints on Q4 guidance; Nvidia and the hyperscalers become the market's biggest losers in a day that Fortune describes as reigniting full-blown bubble fears (8 Jun 2026).
- July 2026 — AI stocks crash on reports that Nvidia was preparing to finance a ~€216bn OpenAI buildout, reviving fears about circular financing between the chip supplier and its biggest customer (Yahoo Finance/MarketWatch, 27 Jul 2026).
- September 2026 — Analysts note "the underlying debate that caused the wobble hasn't actually been resolved" (MoneyMagpie, 24 Sep 2026).
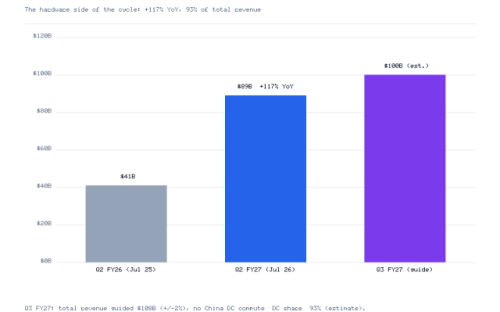
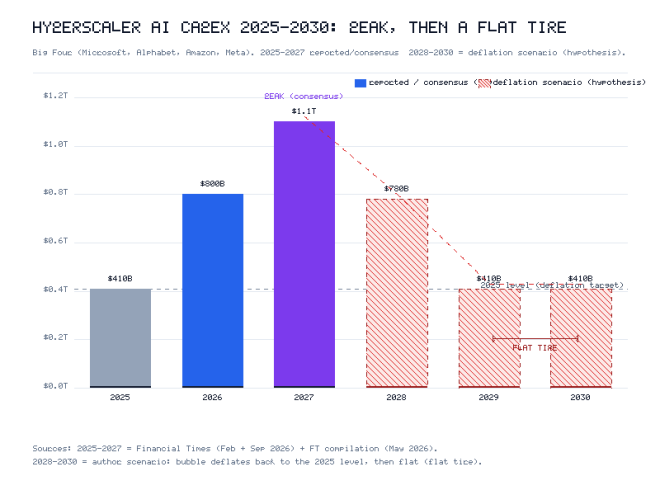
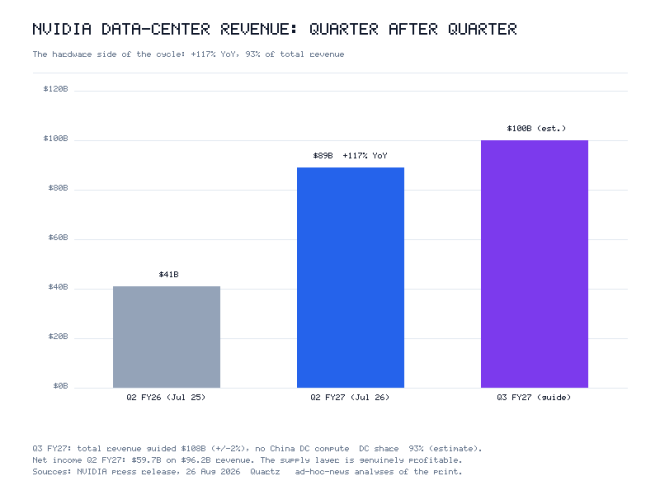
So where does that leave us? A bubble that showed visible cracks, survived on the strength of real revenues (Nvidia's data-center business posted €77bn in a single quarter in Q2 FY2027, up 117% year-over-year), and is now being propped up by ever-larger commitments — Goldman Sachs projects hyperscaler capex approaching €983bn in 2027.
The question this article tackles is whether the fundamentals underneath the bubble are quietly being undermined by two forces: models getting dramatically smaller and cheaper per unit of capability, and dedicated inference silicon arriving on a documented 2027 timetable. Both attack the single assumption the whole capital boom rests on: that compute is, and will remain, scarce.
2. How much is actually being invested? (the numbers, with sources)
The most reliable anchor numbers come from company guidance compiled by the FT and covered by CNBC, Statista, and Business Insider:
| Scope | Amount (€) | Source |
|---|---|---|
| 2025 actual capex, 4 hyperscalers | ~€353bn | FT-compiled earnings data (via Business Insider / Yahoo Finance) |
| 2026 guided capex, 4 hyperscalers | ~€625–655bn (+77%) | FT-compiled (Business Insider, 31 Jul 2026); Statista chart 35046; CNBC, 6 Feb 2026 |
| 2026 capex, 5 firms incl. Oracle | ~€690bn | The Economist, 13 May 2026 |
| 2026 quarterly run-rate | >€112bn in one quarter | NYT, 29 Apr 2026 |
| 2027 hyperscaler capex projection | ~€983bn | Goldman Sachs (via Value Add VC, May 2026) |
| Global data-centre systems spending 2025 → 2026 | €428bn → €563bn (+31.7%) | Gartner, 3 Feb 2026 (via The Next Platform / CIO) |
| Global data-centre spend to 2028 | ~€2.59tn (of which ~€1.21tn from hyperscaler cash flow; rest: debt) | Morgan Stanley (via The Guardian, 2 Nov 2025) |
| Data-centre debt by 2028 | potentially >€862bn | Morgan Stanley (as reported by FT, Dec 2025) |
| US data-centre + AI infrastructure investment 2025–2032 | €8.88tn ≈ 3.6% of GDP per year | Economist Stijn van Nieuwerburgh (via WSJ, Sep 2026) |
| AI infrastructure over 5 years | €4.48tn | McKinsey (via The Economist, 30 Sep 2025) |
| Investment-grade bond issuance for AI data centres | record €76bn in a period | FT (Sep 2026) |
Cross-checks on the hardware side of the spend:
- Nvidia: Q2 FY2027 (quarter ended 26 Jul 2026) revenue €83bn, of which €77bn from Data Center (+117% y/y) (NVIDIA investor release, 26 Aug 2026). FY2026 total revenue was a record €186bn (+65%); FY2026 data-centre revenue €170bn, up from €99bn in FY2025 (Fortune, 25 Feb 2026).
- Broadcom: AI semiconductor revenue €7.2bn in Q1 FY2026 (+106% y/y), full-year FY2026 AI revenue guidance of €48bn, a €63bn AI order backlog, and a stated target of €86bn in annual AI chip revenue by 2027 (Broadcom earnings; Tom's Hardware, 21 May 2026; TechTimes, 3 Sep 2026).
- Market sizing (treat with care — research houses disagree widely): AI accelerator markets are estimated anywhere from ~€86bn to ~€151bn in 2026 depending on scope (Roots Analysis; Mordor Intelligence, Sep 2026), with inference-optimized accelerators projected to overtake training gear (GMI Research).
The FT's data-journalism piece "Inside the relentless race for AI capacity" sums it up: Microsoft, Alphabet, Amazon and Meta alone planned to raise capex past €259bn in 2025 (and did, ~€353bn), while Gartner saw €410bn spent on data centres that year, up 42% on 2024.
3. Diagram: where the money goes
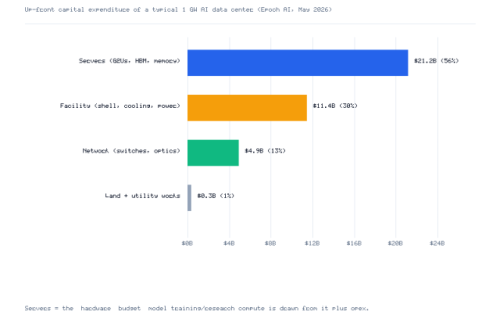
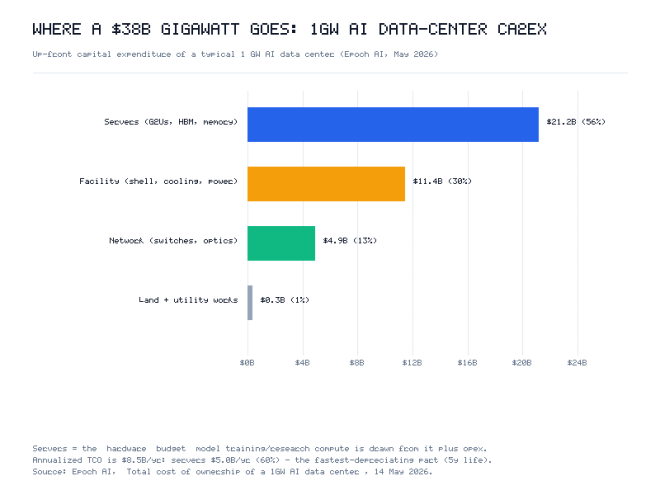
Important caveat: no single authoritative source publishes a clean official split of the ~€625bn 2026 hyperscaler capex into "data centres vs hardware vs model research." The allocation below is an approximation derived from the sources above — Gartner's data-centre systems spend, Nvidia/Broadcom hardware revenue runs, Morgan Stanley's construction/debt estimates, and The Economist's coverage of the cash-flow burden. Treat the percentages as a reasoned estimate, not a measured fact.
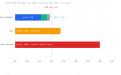
The AI build-out — approximate allocation of ~€625bn 2026 hyperscaler capex
(estimate derived from FT-compiled guidance, Gartner, Morgan Stanley, company reports)
| # | Bucket | Share | Amount | Key anchors |
|---|---|---|---|---|
| 1 | Compute hardware (GPUs / TPUs / ASICs / HBM) | ~50–60% | €315–379bn | Nvidia DC run-rate €77bn/qtr (Q2 FY27, +117% y/y); Broadcom €48bn FY26 guide, €63bn backlog, €86bn 2027 target; AMD MI-series, Marvell, Intel secondary |
| 2 | Data-centre construction & real estate (shells, fit-out, cooling) | ~25–30% | €155–190bn | Gartner DC systems spend €563bn 2026 (+31.7%); Morgan Stanley ~€2.59tn to 2028, €1.21tn self-funded; Equinix/Alibaba bubble warnings (Guardian, Nov 2025) |
| 3 | Power & grid infrastructure (turbines, transformers, interconnect) | ~8–12% | €52–78bn | The Economist (May 2026): cash flows "sacrificed" largely to feed power-hungry sites; power = the binding constraint |
| 4 | Networking & optics (switches, InfiniBand, transceivers) | ~5–10% | — | — |
| 5 | Model R&D / training runs / software (lab salaries + training compute) | ~5–10% | €34–65bn | The Economist (Sep 2025): demand lags supply as labs scale runs |
Scale context (multi-year)
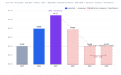
| Year | Hyperscaler capex | Other anchors |
|---|---|---|
| 2024 | ~€241bn (base) | — |
| 2025 | ~€353bn (FT-compiled) | ~€428bn Gartner DC systems |
| 2026 | ~€625bn (FT-compiled) | ~€563bn Gartner DC systems |
| 2027 | ~€983bn (Goldman Sachs projection) | — |
| 2028 | — | ~€2.59tn cumulative DC spend (Morgan Stanley) |
| 2032 | — | €8.88tn US AI infrastructure 2025–32 (WSJ / van Nieuwerburgh) |
Read that chart two ways. Optimists see the largest infrastructure build-out since highways. Pessimists — the FT's "impossible maths" authors, Morgan Stanley's debt watchers, and The Economist's May 2026 piece — see the same numbers and ask: who is the demand on the other end of this pipe? Morgan Stanley's own framing is telling: the hyperscalers expect 15–20% returns on ~€3.28 trillion invested between 2024 and 2028 (as reported by Investopedia, 2026). That is the bar the entire buildout must clear, and it is where the bubble's mathematics get thin.
4. Thesis one: the models are shrinking, and the buildout may be over-engineered for the job
The strongest structural bear case against the capex boom rests on a single observation: capability per parameter is rising so fast that the hardware bill is being paid for a scaling law that is partially being retired.
4.1 The capability-per-parameter curve is bending hard
The 2023–2024 intuition was "bigger is better": scale parameters, scale tokens, scale GPUs. The past two years have quietly broken that. Concrete markers:
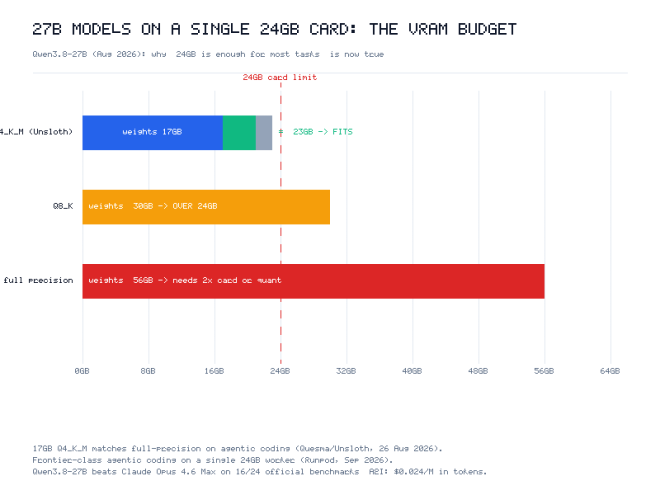
- Qwen3.8-27B (2026) — a dense 27B model with vision and reasoning capabilities and a 256K context window that, per the official local-run documentation, runs on 17GB of RAM/VRAM (Unsloth model docs, unsloth.ai/docs/models/qwen3.8). Eighteen months ago, comparable agentic-coding and chat performance required 70B–405B-class models on multi-GPU boxes.
- Distillation proved the gap could be closed by construction, not scale. DeepSeek-R1's distilled variants (e.g., R1-Distill-Qwen-32B) replicated frontier-level reasoning behaviour in a third of the parameter count — reasoning, the scarcest capability, became portable (Qwen3 technical report, arXiv:2505.09388).
- The 2026 small-model landscape is a category of its own now. Turing Post's May 2026 comparison treats GPT-5.4 mini, Gemma 4, Ministral 3, Phi-4, the Qwen3 family, SmolLM3 and Nemotron 3 Nano as production-grade workhorses — not toys (Turing Post, 13 May 2026).
- 8B-class models (Qwen3 8B, Gemma, SmolLM3) now do useful agentic work, tool calling, and structured extraction that in 2024 required API calls to 70B+ models (community benchmarks, 2026; Hugging Face local-model guides, May 2026).
4.2 The learning curve is saturating: exponential effort, marginal gains
The shrinkage of models is not just an engineering trend — it is a statement about the learning curve itself. The evidence:
- Benchmarks are saturating on a timescale of months, not years. The Stanford HAI AI Index reports that evaluations "intended to be challenging for years are saturated in months" (Stanford AI Index 2025/2026, as cited by Splunk, 9 Sep 2026). The 2026 AI Index adds that frontier models still fail roughly one in three attempts in production (VentureBeat, 15 Apr 2026) — the remaining gap is reliability and integration, not model scale.
- Diminishing returns are now an active research area. A 2026 survey of scaling in LLM reasoning devotes a section to identifying when scaling strategies yield diminishing returns (arXiv:2504.02181, v2 Apr 2026); earlier work on "the investment implications of scaling law saturation" (Kelley, 16 Nov 2024) already argued that the marginal capability per additional training dollar is falling.
- The "densing law" flips the economics. A Nature Machine Intelligence result ("Densing law of LLMs", 6 Nov 2025) finds that, given a fixed chip price, the effective size of the largest LLM that can be run grows exponentially — i.e., the same hardware runs a bigger model each year, and the same model runs on cheaper hardware each year.
Put together, these findings describe a curve that has passed its point of maximum marginal return: each additional unit of capability now requires disproportionately more effort (data, compute, engineering) than the last, while the gap to "good enough" for most production tasks has already closed — a 27B model on a 24GB card covers the modal use case. The economic optimum is therefore shifting from "bigger frontier" to "narrower, efficient, specialised models" — and the €625bn build-out is pricing in the scaling law of 2023.
4.3 Do the VRAM arithmetic
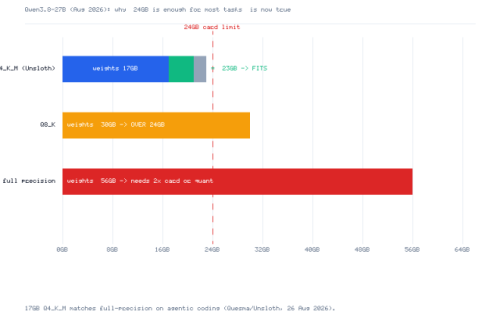
This is where the "24GB is sufficient" claim becomes a quantified engineering fact. Qwen3.8-27B at 4-bit quantisation (≈0.55–0.60 bytes/param, e.g. GGUF Q4 / NVFP4):
| Component | Memory |
|---|---|
| Weights (27B × ~0.58 B) | ≈ 15.5 GB |
| KV cache (moderate context) | ≈ 1–3 GB |
| Runtime overhead / CUDA / fragments | ≈ 1 GB |
| Total | ≈ 18–20 GB |
The vendor's own local-run documentation puts the working floor at 17GB (Unsloth, Qwen3.8 page) — meaning a single RTX 4090/5090-class 24GB card, or a Mac Studio with unified memory, or a €4,300 dev box is the unit of deployment, not an exception. A year ago that unit was 40–80GB. The one honest caveat: at the full 256K context window, the KV cache can push past 24GB — long-context serving still wants more memory, and MoE siblings of this class (e.g., Qwen3.8-2.4T-A95B, 95B active) are a different ballgame entirely. But for the modal production task, 24GB is the economic unit of inference.
4.4 Why this attacks the bubble's core assumption
The capex boom rests on a scarcity story: compute will be the scarce resource for the next decade (that is literally the framing in the capex commentary reviewed here). But efficiency progress attacks scarcity from three directions at once:
- Inference demand grows on cheaper hardware. Every application that previously needed a 70B API call now needs a 27B local model. Token prices on this class are already a fraction of 2024 frontier pricing (e.g., Qwen3-32B at ~€0.07/M input tokens, per LLM Stats) — and local inference is €0 per million tokens plus electricity.
- Training demand grows more slowly than parameter demand. Distillation, synthetic data, and RL on smaller backbones mean a frontier lab's marginal capability gain increasingly comes from better recipes than more GPUs. The Economist noted as far back as September 2025 that "demand lags behind supply" (The Economist, 30 Sep 2025) — the supply side is being built for a scaling law that is partially being retired.
- Depreciation becomes a weapon. If a 2027 ASIC runs a 27B-class model at 10× the perf-per-watt of a 2024 GPU, the useful life of installed capacity collapses. That is the bubble's quiet killer: not a demand shock, but a productivity shock that makes yesterday's €625bn partially redundant before it is paid off. Morgan Stanley's 15–20% return hurdle becomes much harder when the denominator (required compute) shrinks.
The fair counter-arguments, stated honestly: reasoning models multiply tokens-per-task (test-time compute is real); agentic workloads multiply call counts; and frontier training still needs massive pools. So compute is not "dead." But the capex-per-unit-of-capability trend is firmly negative — which means the buildout has to keep outrunning efficiency just to stand still, while efficiency historically accelerates. That is a treadmill, and treadmills break.
5. The 2027 inference-silicon wave: the documented schedule
Dedicated AI-inference silicon is not a forecast; it is already booked, taped-out, or in sampling. The public record as of September 2026:
| Player | Product / programme | Documented 2027 milestone | Source |
|---|---|---|---|
| Broadcom | Custom ASICs for hyperscalers | €86bn AI-revenue target by 2027; €63bn backlog already booked | Tom's Hardware, 21 May 2026 |
| OpenAI | "Jalapeño" (B0), TSMC N3P | Inference-efficiency measured against Blackwell-class systems; first generation already characterised | SemiAnalysis; CNBC, 26 Aug 2026 |
| Anthropic | Co-designed accelerator; talks with Fractile (UK) | Fractile inference chips available in 2027; Samsung reported as manufacturing partner | tbreak, 4 May 2026; Tom's Hardware |
| Qualcomm | "Dragonfly" rack-scale inference line | AI250 in 2027 (AI200 sampling 2026, AI300 ~2028) | Supercomputing News |
| TPU v6 / next generation | successive generations shipping within 2026–27, already inside the capex | Alphabet capex commentary (Value Add VC, May 2026) | |
| AWS / Microsoft / Meta | Trainium/Inferentia, MAIA, MTIA | 3rd-generation parts shipping within the window | Tom's Hardware ASIC state-of-play, May 2026 |
| Groq / Cerebras / Etched | Inference-optimised challengers | Groq 3 LPX targeted at low-latency token generation; Etched Sohu for transformer inference | New Market Pitch, Aug 2026; Supercomputing News |
Three observations from this table:
- The economics are the story, not the performance. Tom's Hardware puts the total-cost-of-ownership advantage of custom inference silicon at up to ~65% lower than GPU-based inference for matching workloads. Even at half that number, the 2027 parts change the unit economics of every data centre built before them.
- The circularity risk gets worse, then better. The July 2026 market crash over the reported Nvidia–OpenAI €216bn financing arrangement was, at heart, a circularity scare: the chip supplier financing its customer, who then buys the chips. The 2027 ASIC wave breaks that circle — OpenAI, Anthropic, Google, AWS all becoming their own silicon supply chain reduces dependence on exactly one vendor's pricing power.
- The 2027 date is contractual, not speculative. A €63bn backlog at Broadcom and an €86bn revenue target "by 2027" are not predictions — they are booked demand. The risk is not that the chips don't arrive; it is that they arrive and compress Nvidia's margin sooner than the market prices.
6. The synthesis: a bubble that deflates, rather than bursts
Putting the two theses together produces a scenario that is arguably scarier than a crash, because it is slower:
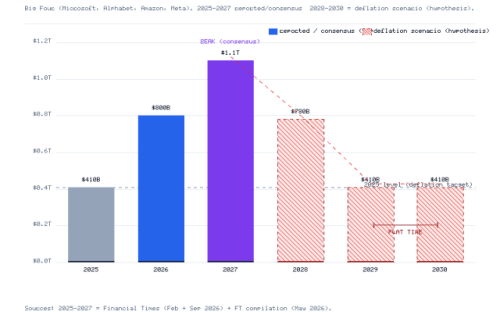
- 2026–2027: capex peaks (~€983bn in 2027 per Goldman), debt-funded share grows (Morgan Stanley's >€862bn data-centre debt by 2028), and the 2027 ASIC cohort ships.
- 2027–2028: inference cost-per-token falls by an order of magnitude on ASICs + 27B-class models; the "compute scarcity" narrative that justified the peak capex loses credibility.
- 2028–2029: depreciation schedules, power contracts, and bond maturities (the FT's €76bn investment-grade AI issuance wave) meet a slower-growing revenue base. Morgan Stanley's 15–20% hurdle starts to fail for the marginal gigawatt — not for the first ones.
That is the FT's "impossible maths" and The Economist's "murky economics" playing out on a schedule: not a dot-com-style cliff, but a long, grinding underperformance — capacity sitting idle, GPUs depreciating faster than they earn, and a debt stack (potentially >€862bn by 2028) that was priced for a growth story that efficiency is quietly retiring.
The bull's best rebuttal, for balance: Nvidia's ~56% net margin in fiscal 2025 (€63bn net income on ~€112bn revenue; Fortune, 25 Feb 2026) and +106% revenue growth in fiscal Q2 2027 (quarter ended 26 Jul 2026, revenue €83bn) show this is not 2000 — someone is actually buying, and using, the compute. But note who is buying: the four buyers are each other's suppliers' customers, financed in part by their own bonds, betting on a scarcity assumption that the 27B-on-24GB trend and the 2027 ASIC wave are both dismantling.
Fiscal-year note (for precision): NVIDIA's "fiscal 2027" is the 12-month period ending January 2027. "Q2 FY2027" is the quarter ended 26 July 2026, reported 26 August 2026. "Fiscal 2025" ended 26 January 2025. Calendar year ≠ fiscal year; all growth figures above are stated against the fiscal labels as published by NVIDIA.
7. Signals to watch
Which numbers could AI investors look at, to make the right decisions? This is a static snapshot built exclusively from public data in the source list (all € at 1 EUR = 1.16 USD). Statuses: OK = demand-side strength; WATCH = trend to monitor; ALERT = rising risk.
S1 · Hyperscaler capex (4 firms, actual vs guided) — WATCH
| Year | Value |
|---|---|
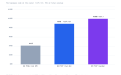
| 2025 actual | €353bn |
| 2026 guided | €625bn (+77%) |
| 2027 forecast | €983bn (Goldman) |
Read: capex growth is compounding faster than any published AI-revenue base can currently justify. First cut to the 2027 guide = first domino.
S2 · Nvidia data-center revenue (quarterly) — OK
| Quarter | Revenue | YoY |
|---|---|---|
| Q4 FY26 (Jan 2026) | €54bn | +75% |
| Q1 FY27 (Apr 2026) | €65bn | +92% |
| Q2 FY27 (Jul 2026) | €77bn | +117% |
Read: demand is real and accelerating. The signal to watch is the first quarter where DC growth falls below capex growth — the decoupling point.
S3 · Broadcom AI-chip revenue (quarterly, custom silicon) — OK
| Period | Revenue / value |
|---|---|
| Q1 FY26 (Nov 2025) | €7.2bn (YoY +106%) |
| Q3 FY26 (Aug 2026) | €14.4bn (YoY +221%) |
| FY26 guide · backlog · 2027 target | €48bn · €63bn · €86bn |
Read: the 2027 ASIC wave is on schedule. This is the bear case's engine: every point of share shift from GPUs erodes the scarcity premium.
S4 · 27–32B-class model cost (efficiency curve) — ALERT for bulls
| Year | Cost per capability |
|---|---|
| 2025 | API price, 32B class (Qwen3-32B) ≈ €0.07 / M input tokens |
| 2026 | local, Qwen3.8-27B on 17–24GB VRAM ≈ €0 + electricity |
Read: cost-per-capability falling faster than capacity is being built. This is the core deflation mechanism in thesis one.
S5 · AI data-centre debt (financial plumbing) — ALERT
| Period | Value |
|---|---|
| 2025–26 | record €76bn investment-grade issuance in a period (FT) |
| 2028e | >€862bn total data-centre debt (Morgan Stanley) |
Read: the one number that can convert a valuation wobble into a solvency event. Watch spreads on AI data-centre bonds vs Treasuries.
Market event timeline (no price levels used — all verified in sources)
| When | Event |
|---|---|
| Nov 2025 | Reuters "Bubble Trouble"; Pichai "no company unscathed" |
| Feb 2026 | FT: "breathtaking" €569bn spree; later revised to €625bn |
| May 2026 | FT "impossible maths"; Economist: cash flows "sacrificed" |
| Jun 2026 | Broadcom guidance shock → broad AI selloff (Fortune) |
| Jul 2026 | NVDA–OpenAI €216bn financing reports → AI stocks crash |
| Sep 2026 | "The underlying debate that caused the wobble hasn't actually been resolved" (MoneyMagpie) |
For those who want to build a dynamic version of the signals, all data points in S1–S3 are public quarterly series (NVIDIA and Broadcom 10-Q/8-K filings; FT-compiled capex guidance) and can be plotted in a small dashboard. The two signals that genuinely cannot be charted from public data are S4 (no standard public token-price index exists) and S5 (bond spreads live in Bloomberg/Refinitiv) — for those, the honest dashboard is the directional markers shown.
8. Conclusion
The near-collapse of 2026 was not a failure of demand; it was the market briefly pricing in the mathematics that the FT and The Economist have been printing all year. The bubble survived the wobble because the revenues are real. But the two forces identified in this article are, in my view, the ones most likely to end the story: a capability curve that keeps moving the "sufficient model" from 70B to 27B to 8B, and a 2027 generation of purpose-built inference silicon that will cut the cost floor of the entire buildout in half. Between them, they convert the AI investment story from a scarcity trade into a productivity trade — and in productivity trades, the capital that was deployed to create scarcity is the part that loses.
9. Disclaimer
Research and writing of this article has been mostly performed by a locally hosted LLM qwen3.8-27B on a 24G GPU, powered with locally produced solar energy (see my previous blog post on running AI locally) and a searxng server, producing a 275100 context window. For transforming markdown into html the model decided to write its own parser and a software rasterizer with png encoder for generating the images and a compressor with Huffman RFC 1951, as it could not find appropriate MCPs for those tasks. So this article is a "live" fact check, that today's 27B models are good enough even for solving complex tasks and that they have built in investigation skills, we could not have dreamed of two years ago. And the competition just started - at least the AI tech bros pretend us to believe that we all need to invest as the scores still have to rise. Really?
Sources
(Original USD figures; € conversions in the body at 1 EUR = 1.16 USD, the 2026 ECB average reference rate.)
Financial Times
- Big Tech's "breathtaking" $660bn spending spree reignites AI bubble fears (6 Feb 2026) — ft.com/content/0e7f6374-3fd5-46ce-a538-e4b0b8b6e6cd
- Lex in depth: Will the AI data centre boom become a $9tn bust? (27 Mar 2026) — ft.com/content/805f78f3-8da3-4fc0-b860-207a859ac723
- The impossible maths of the AI boom (19 May 2026) — ft.com/content/32bf8935-8d21-4689-ae34-8b4d3d5f6d93
- Inside the relentless race for AI capacity (data journalism; Gartner $475bn/2025 figure) — ig.ft.com/ai-data-centres
- FT compilation of 2026 capex guidance ($725bn), as cited via Business Insider (31 Jul 2026) and Yahoo Finance
The Economist
- The murky economics of the data-centre investment boom (30 Sep 2025; McKinsey $5.2trn/5yr) — economist.com/business/2025/09/30/the-murky-economics-of-the-data-centre-investment-boom
- Big tech is sacrificing its cash flows to prop up the AI boom (13 May 2026; ~$800bn/2026, five firms) — economist.com/business/2026/05/13/big-tech-is-sacrificing-its-cashflows-to-prop-up-the-ai-boom
Market & company data
- CNBC, Tech AI spending approaches $700 billion in 2026 (6 Feb 2026)
- Statista chart 35046, Big Tech's AI spending to reach $760bn in 2026
- NYT, A.I. Spending Sets a Record, With No End in Sight (29 Apr 2026)
- Gartner press release (3 Feb 2026): data-centre systems $653.4bn 2026, +31.7%; servers +36.9% (via The Next Platform, 9 Feb 2026; CIO)
- The Guardian, Boom or bubble? Inside the $3tn AI datacentre spending spree (2 Nov 2025; Morgan Stanley figures)
- WSJ (Sep 2026), via Heise/Breitbart: Stijn van Nieuwerburgh, $10.3trn 2025–2032 ≈ 3.6% of GDP/yr
- NVIDIA: Q2 FY2027 release (26 Aug 2026) — revenue $96.2bn (+106% y/y), Data Center $89.0bn (+117% y/y) — investor.nvidia.com; Q1 FY2027 release (20 May 2026) — revenue $81.6bn (+85%), Data Center $75.2bn (+92%); Q4/FY2026 release (25 Feb 2026) — FY2026 revenue $215.9bn (+65%); SEC Q4 FY26 CFO commentary
- Fortune, Nvidia smashes Q4 2026… (25 Feb 2026) — FY2025 net income $72.9bn; FY2026 DC revenue $197.3bn vs $115.2bn FY2025
- Broadcom: Q1 FY26 AI revenue $8.4bn (+106%); Q3 FY26 AI revenue $16.7bn (+221%), FY26 AI guidance $56bn (TechTimes, 3 Sep 2026); $73bn backlog / $100bn-2027 target (Tom's Hardware, 21 May 2026)
- Reuters, Bubble Trouble: AI rally shows cracks (21 Nov 2025)
- Fortune, Top analyst fears bubble popping… (8 Jun 2026)
- Yahoo Finance, AI Stocks Crash After NVIDIA Plans to Finance $250 Billion OpenAI… (27 Jul 2026)
- Investopedia (2026): Morgan Stanley 15–20% return hurdle on $3.8trn (2024–2028)
- ECB, Euro reference exchange rates USD (2026 average 1.1621; range 1.1340–1.1974) — ecb.europa.eu
Chips 2027
- SemiAnalysis, OpenAI Jalapeño: Better Than Nvidia Blackwell (B0, TSMC N3P)
- CNBC, OpenAI's Jalapeño AI chip brings new 'threat' to Nvidia margins (26 Aug 2026)
- tbreak, Why Anthropic wants to break free from Nvidia — Fractile chips available 2027 (4 May 2026)
- Tom's Hardware, Anthropic co-designing custom AI inference chips… Samsung; The custom AI ASIC state of play (21 May 2026; TCO up to ~65% lower)
- Supercomputing News, Inference Chips vs. Nvidia — Qualcomm AI200 (2026) / AI250 (2027) / AI300 (~2028)
Model efficiency & scaling saturation
- Unsloth model docs — Qwen3.8: Qwen3.8-27B (vision + reasoning, 256K context, runs locally on 17GB RAM/VRAM; Qwen3.8-2.4T-A95B) — unsloth.ai/docs/models/qwen3.8
- "Densing law of LLMs," Nature Machine Intelligence (6 Nov 2025) — nature.com/articles/s42256-025-01137-0
- Stanford HAI, Artificial Intelligence Index Report 2025 & 2026 — hai.stanford.edu/ai-index (benchmark saturation; "saturated in months" quote via Splunk, 9 Sep 2026; 2026 Index production-failure rate via VentureBeat, 15 Apr 2026)
- Kelley, "The investment implications of scaling law saturation" (16 Nov 2024) — countkelleyin.substack.com
- "A Survey of Scaling in Large Language Model Reasoning," arXiv:2504.02181 (v2, Apr 2026)
- Qwen3 Technical Report — arXiv:2505.09388 (incl. DeepSeek-R1-Distill-Qwen-32B baselines)
- TIMETOACT LLM benchmark roundups (Apr 2025, Summer 2025) — 32B-class models near-SOTA for local deployment
- LLM Stats — qwen3-32b (~$0.08/M input tokens)
- Turing Post, Small Language Models in 2026: 10 to Know (13 May 2026)
- Hugging Face community guide, Open source LLMs to run locally (13 May 2026)
Honesty notes
- The allocation diagram in §3 is a derived estimate — no publisher splits the €625bn into exactly those buckets.
- Market-size figures for "AI chips" vary 3–5× between research houses and that variance is flagged where used.
- The 53% net-margin figure from an earlier draft could not be attributed to a fiscal year by a reliable source and was replaced with the verified fiscal-2025 figure (~56%).